8. FAQ
8.1. Basic Questions
- If you encounter a problem that cannot be solved for a long time
If you encounter problems that take a long time to resolve, please contact the relevant
FAEfor support. Also note that you should try to use the latest version of the toolchain for model conversion.
- joint Basic model information
jointmodel basic information:Model input
DTypeoftensordefaults toUINT8andLayouttoNHWC.Model output
DTypeoftensordefaults toFLOAT32,LayoutisNCHW.ColorSpace: defaults toTENSOR_COLOR_SPACE_AUTO, which can be automatically recognized based on the model inputchannelnumber3-channel:
BGR1-channel:
GRAYOther options:
RGB,NV12,NV21,BGR0
- If you need to change the VNPU settings, you need to recompile, but you can't change the VNPU settings directly through the existing joint
It is not technically possible to change the
vnpusettings directly from thejointmodel, because:the toolchain needs to compile the model based on the input configuration information during compilation, and compilation is to gradually turn the initial model into binary instruction code, which requires a lot of raw information of the model
compilation is a continuous
loweringprocess, which will lose information, and the compiled binary instruction code cannot recover the original model information.besides, different
vnpuconfigurations will use different hardware resources and compile different optimal binary models
In summary, if you need to modify the
vnpumodel, you need to do the conversion again.
- Detection model has OutOfMemory(OOM) error during conversion, how to solve it
If the output
layoutof the detection model isNCHW, the errorOOMwill appear, which is This is becauseNPUoutputslayoutasNHWCby default, and thefeaturemapoutput by the detection model is larger, Thetransposeoutput of the model is large, so it is easy to crowd the memory when directlytranspose. Therefore, you need to specify the outputlayoutwhen detecting the model transformation:pulsar build --input xxx.onnx --config xxx.prototxt --output xxx.joint --output_tensor_layout nhwc
- How to check NPU utilization rate
sshAfter logging into the board, use the following code to view it:$ cd /proc/ax_npu $ echo 1 > enable # Echo 1 > /proc/ax_proc/ax_npu/enable $ cat top_period_ms
- What is the difference between --config and --output_config for pulsar build
--configis a user-friendlyprototxtthat provides a variety of syntactic sugar to simplify configuration--output_configexpands all syntax sugars and saves them as toolchain-friendly configuration filesAt this stage, the
pulsar runemulation function requires the use of--output_configgenerated configuration files
- The simulated fps output in pulsar build differs significantly from the measured fps on the board.
There are two general reasons for the discrepancy, which are model specific
neu fpsis larger because theDDRon the board is not limited, while thepulsarsimulation is strictly stuck on theDDRbandwidthThe smaller
neu fpsis due to the fact that in theCycle Modelof thePulsarsimulation, the small amount previously omitted (e.g.,LUTconfiguration time) becomes non-negligible in somecases.
- How to configure multiple Batches in Prototxt
The following configuration allows you to set the target
batch_sizevalue independently.# Path to configuration file parameters: pulsar_conf pulsar_conf { batch_size: 2 # Set the batch size to 2 for compiling model inference }
- How to configure dynamic Batch in Prototxt
Dynamic
Batchcan be implemented by the following configuration.# Configuration file parameter path: pulsar_conf pulsar_conf { batch_size_option: BSO_DYNAMIC # The compiled model supports dynamic batch batch_size: 1 # Commonly used for practical inference batch_size batch_size: 2 # Commonly used for practical inference batch_size batch_size: 4 # The maximum batch_size is 4 }
For a more detailed description, see pulsar_conf.
- onnx model input is RGB, expect the joint model to be converted to RGB input as well, how should this work?
Configure it in the configuration file as follows:
dst_input_tensors {
  color_space: TENSOR_COLOR_SPACE_RGB
}
- Can the transferred .joint model run on the board like the previous .neu model?
.jointcan run on the board just like.neu. In fact, the.jointmodel is the current mainstream on-board model format and the.neumodel is the old format,Pulsarcan convert the.neumodel to the.jointmodel
- Can PTQ run GPUs?
The toolchain itself supports it, but
dockeritself doesn’t use thenvidiabase image for size reasons
- dataset_output_type defaults to BGR, does it mean that the input to the model is in BGR format when using the image correction from the dataset. If so, should the mean and std in config.prototxt also be set in BGR order?
Yes, they need to be configured in that order. The
dataset_output_typevalue isBGRwhich means that the calibration images are read inBGRformat at compile time, somean/stdhas to be set in BGR order as well.
- How to configure the Q value in config.prototxt
This can be done with the following configuration.
dst_output_tensors {
  data_type: INT16
}
- Is the Q value int16?
Qvalues are not exactlyint16. TheQvalue types can be matched, see data_type type for details.
- How to calculate CPU subgraph time for Q values
The
Qvalue does not have aCPUsubgraph, but the/Qarithmetic operation is left to the client’s post-processing code
- The Q value still has to be connected to the CPU to do the division, which doesn't save time
Yes, you have to connect to the
CPU, but the/Qoperation can be coupled with other operations, and in most cases it is almost freeFor example, if you need to divide after the detection post-processing step
NMS, thenDivisor*Qis sufficientThe detection network alone does a large
tensormultiplication, which may takeNPUseveral times as long, andNMSafter a small computation
- what is the Q-value interface for the transfer model
directly upboard execution
run_joint model.joint, which will be printed in the logThe
C++interface in thejoint sdkalso hasnQuantizationValue.
- Does the toolchain and hardware support sparse acceleration?
Structured sparsity and low bit-width are supported, unstructured sparsity is not supported by hardware.
8.2. View the Inference Report report
According to inference_report can:
Analyze inference bottlenecks:
CONV,DDR,DMA,arithmeticCount the sources of arithmetic power loss
Evaluate the space for continued optimization
Analyze the direction of speed optimization
After the pulsar build command is run, an inference_report folder is saved in the current working directory,
This folder contains one or more
part_x.lavafolders (wherexrepresents the number, starting from0),Each
part_x.lavafolder contains aninference_report.logfile,For small models there is usually only one
part_0.lavafolder and oneinference_report.log,When the model is too large, it is split into multiple sub-models and executed sequentially, so that there are multiple
part_0.lavafolders.
In this case, the tot_cyc of this model is the sum of the tot_cyc of these individual submodels, and the DDR
The total_io_data_size is the sum of the total_io_data_size of these individual submodels.
# Smaller model, contains only the part_0.lava folder
➜  DEMO cd inference_report
➜  inference_report tree -L 2
.
└── part_0.lava
    ├── inference_report.log
    ├── subgraph_0
    ├── subgraph_1
    ├── subgraph_2
    ├── subgraph_3
    ├── subgraph_4
    └── subgraph_5

7 directories, 1 file
View inference_report.log , the example is as follows:
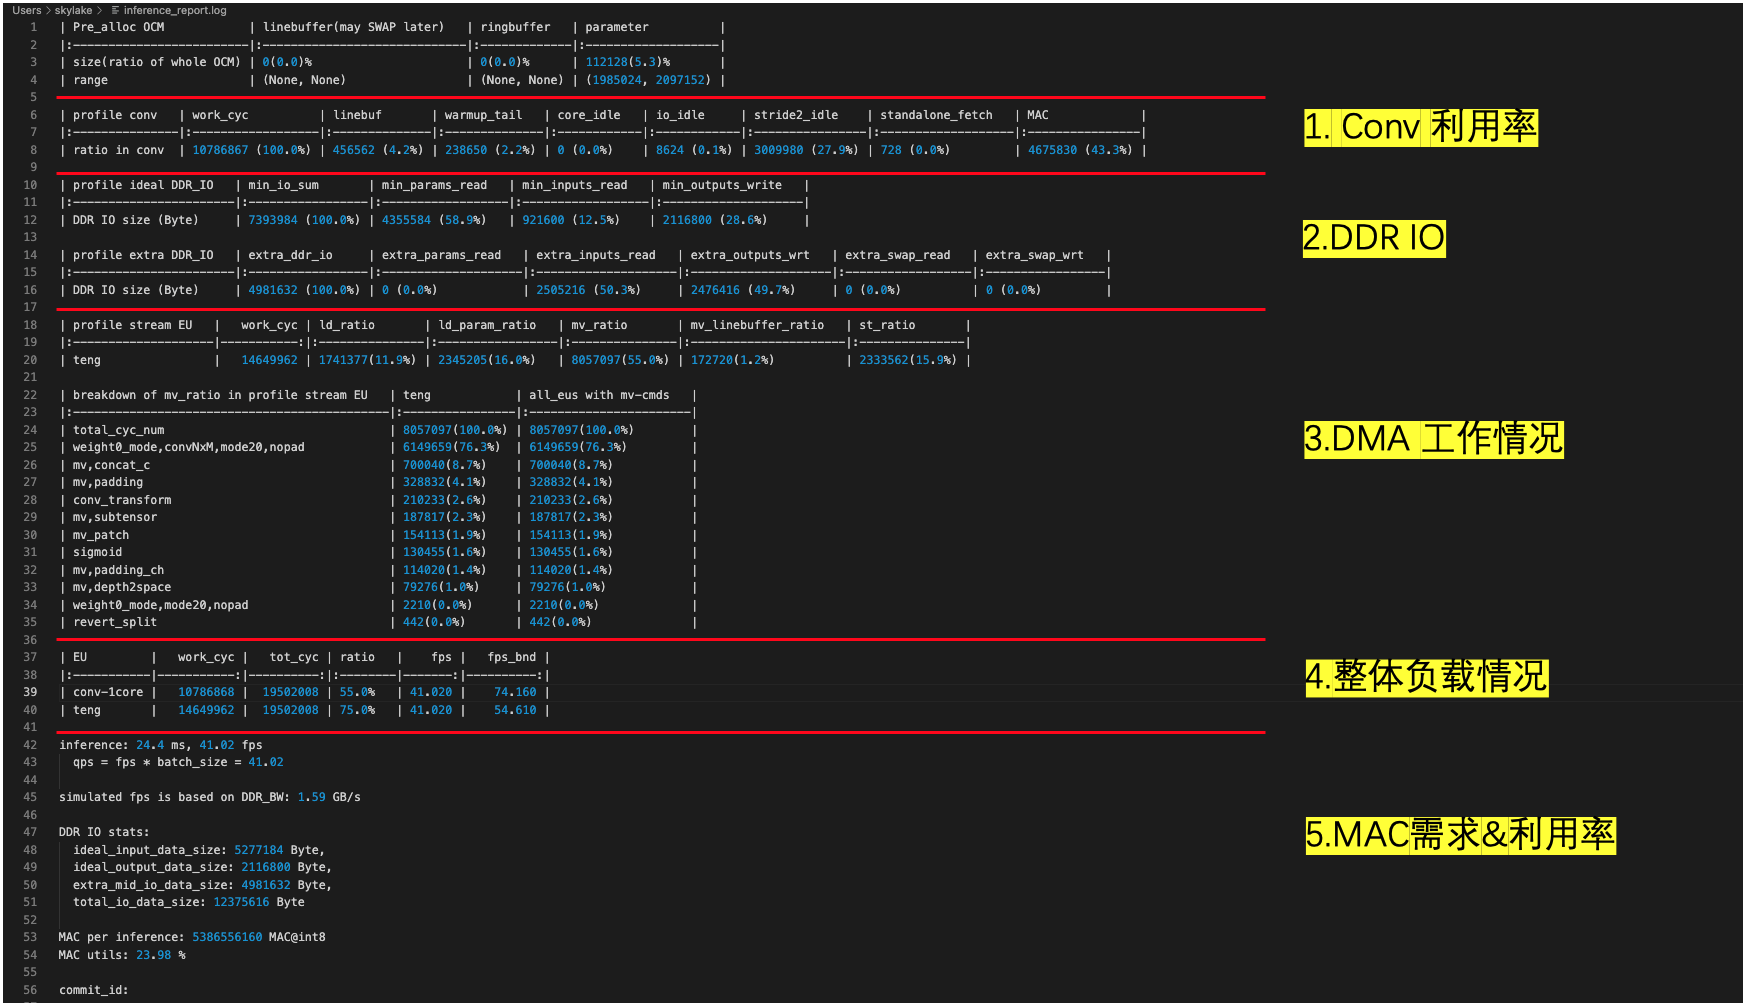
inference_report.log contains some custom terms, some of which are explained below Nomenclature
ld, i.e. read fromDDR, write toOCMst, read fromOCM, write toDDRmv, read fromOCM, write toOCM
The role of inference_report.log is illustrated by a typical example, as in the following case:
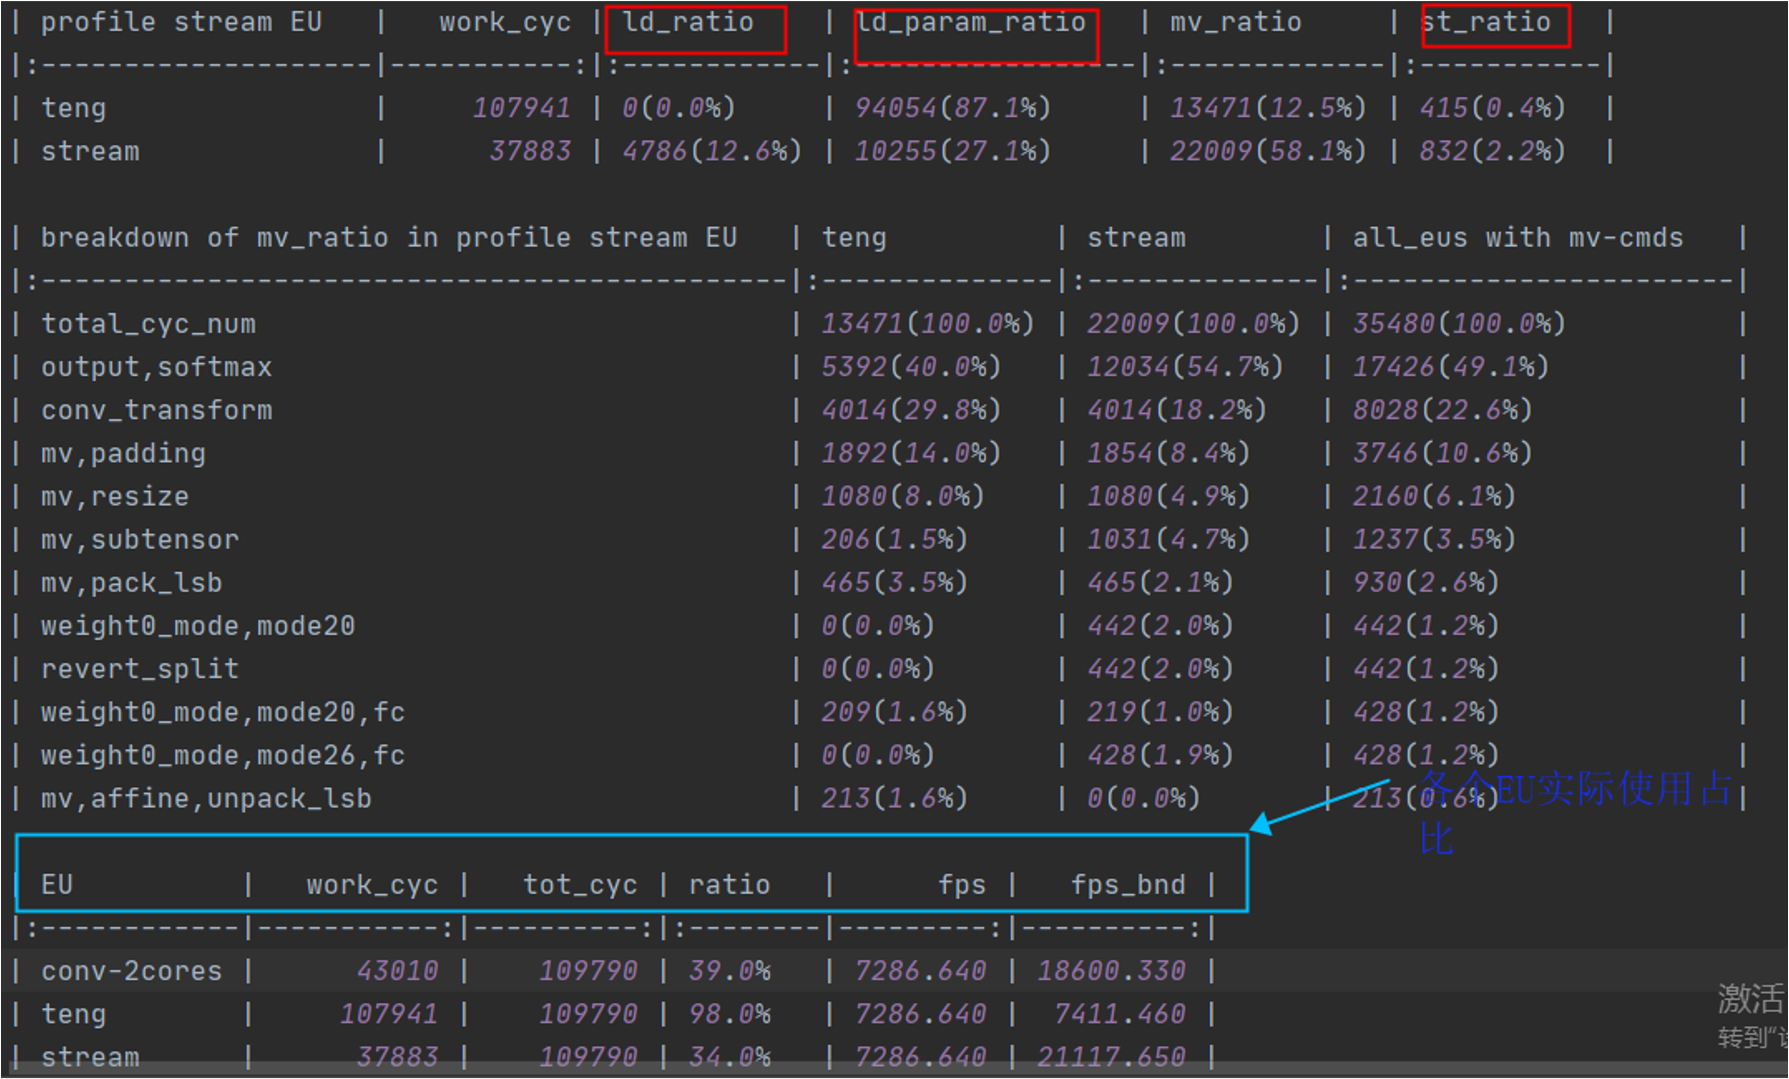
In the non-virtual NPU condition, as shown in the figure (blue box above), three types of EU are involved in model inference, namely conv-2cores, teng and stream,
and the table counts the cycle percentage, physically meaning the cycle actually run for each type of EU divided by the total cycle actually spent on model inference. This ratio provides a visual representation of how busy EU is,
For example, the ratio of teng in the figure reaches 98%, which is almost at full capacity.
teng and stream have the ability to read and write data on DDR. A detailed breakdown of the proportion of each type of task is shown in the profile stream EU,
The values of ld_ratio/ld_param_ratio/st_ratio (red box above) reflect the time and percentage of DDR read/write tasks performed by the corresponding EU, which can be used to analyze the DDR bandwidth pressure.
Summary
In general, the following conditions reflect the speed bottleneck of the model for a given DDR_BW case:
The
ratioofteng/streamis higher and significantly higher than theratioof otherEU
ld_ratio/ld_param_ratio/st_ratiois higher inteng/stream
Conversely, the following condition reflects that the speed bottleneck of the model is the computational power:
The
ratioofconvis higher than theratioof the otherEU``s, and significantly higher than the ``ratioof the otherEU.
More specifically, the ratio of the model teng is 98%, which is significantly higher than the conv’s 39.0%;
The DDR read-write task in teng is 87.1% + 0.4% = 87.5% of the time, which accounts for the majority of the EU work time, so the speed bottleneck of this model is considered to be the DDR bandwidth.
Hint
For the virtual NPU111, there are only two EU``s, ``conv-1core/teng, which are counted in the same way as the non-virtual NPU.